OpenResty XRay
Smart Vital Scanner for Cloud Applications



90%
Reduce up to 90% CPU usage
90%
Locate memory leaks in less than 5 mins
80%
Reduce up to 80% disk I/O saturation and latency
90%
Reduce up to 90% network latency and timeout errors
10x
10x concurrency level by resolving locking and blocking issues
Monitor in real time and provide actionable suggestions
Locate the root cause at the code-level granularity
No code will be ever altered or injected; no plug-ins loaded
Scan across boundaries and observe inside the containers
Analyse filtered and aggregated data to reduce storage needed
Detect remote shell execution, injection attempts in real time
Trace code paths and functions that are only relevant
Support developers and DevOps with command-line utilities in development, testing and production environments
Our Tutorials
OpenResty XRay shows how hardware resources, such as CPU time, wait time, I/O time, disk throughput, memory, and network bandwidth, are distributed across all code, data reference pathways and software layers in applications.
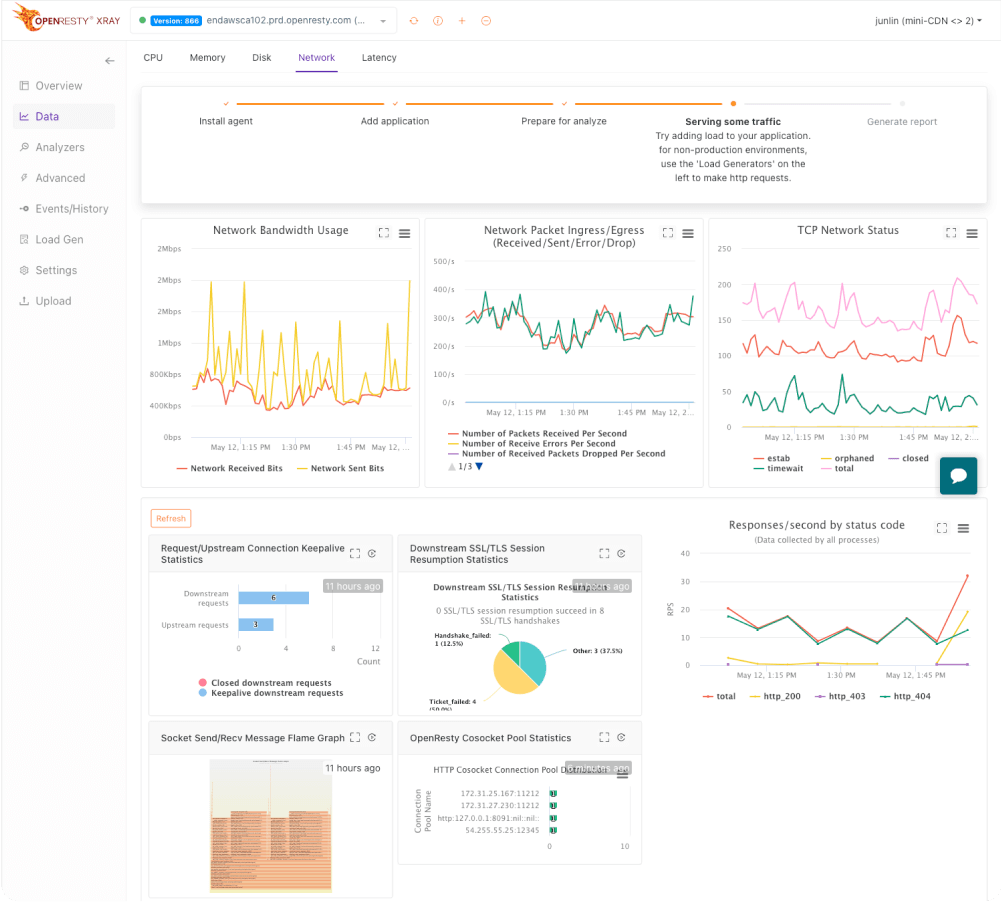
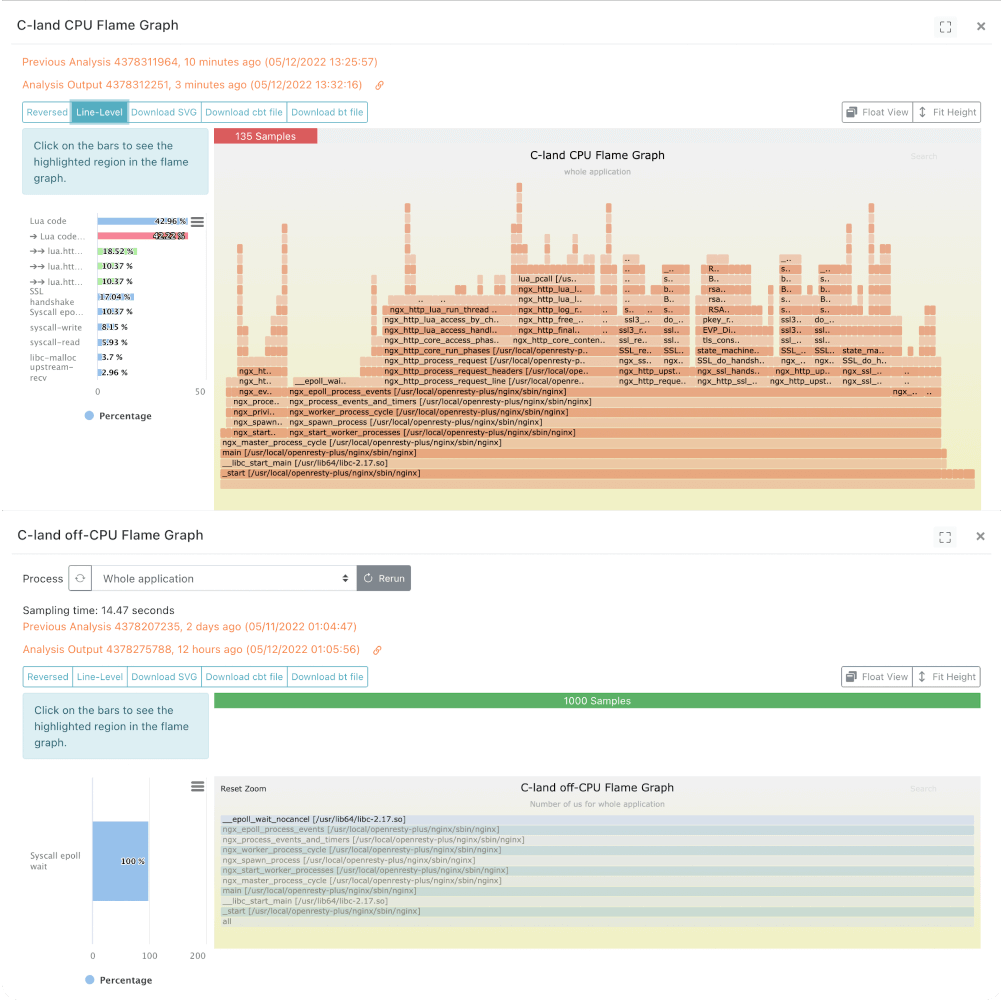
OpenResty XRay can catch issues that are hard to reproduce even in the production environment, using an extremely low resource consuming and noninvasive approach along with sampling triggered by exception indicators.
Users can view collected metrics data in OpenResty XRay or export it to other data analytics platforms for visualization.
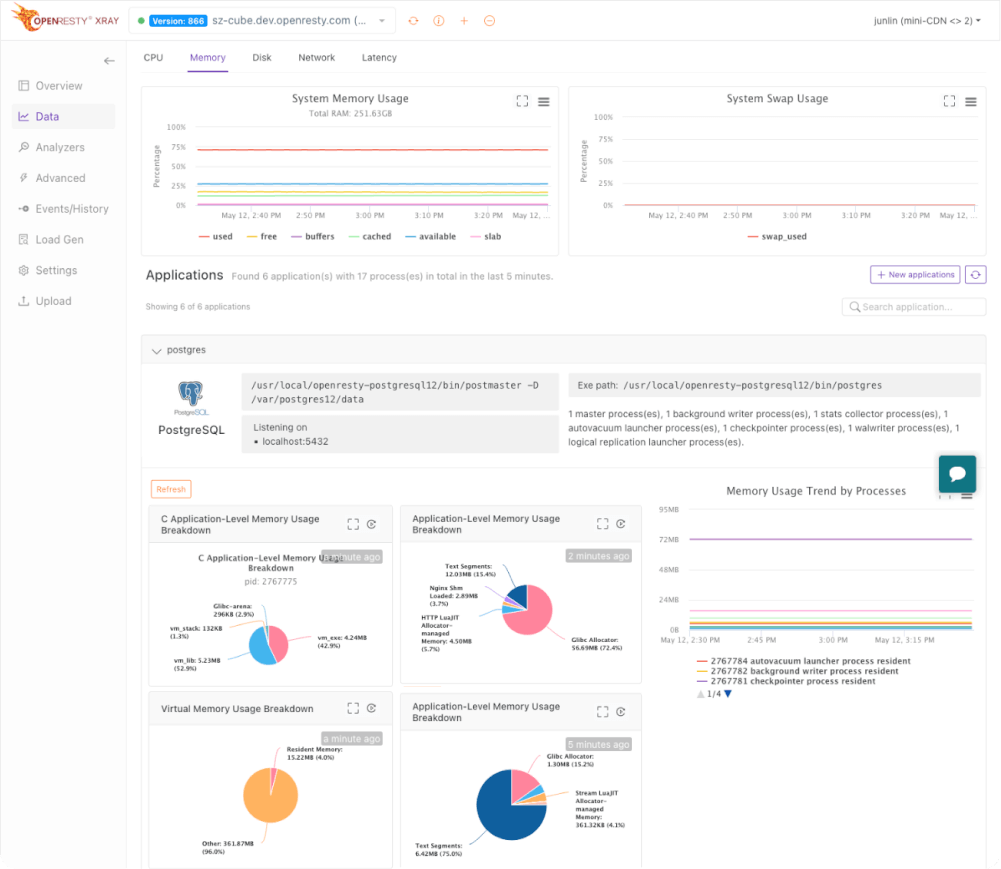

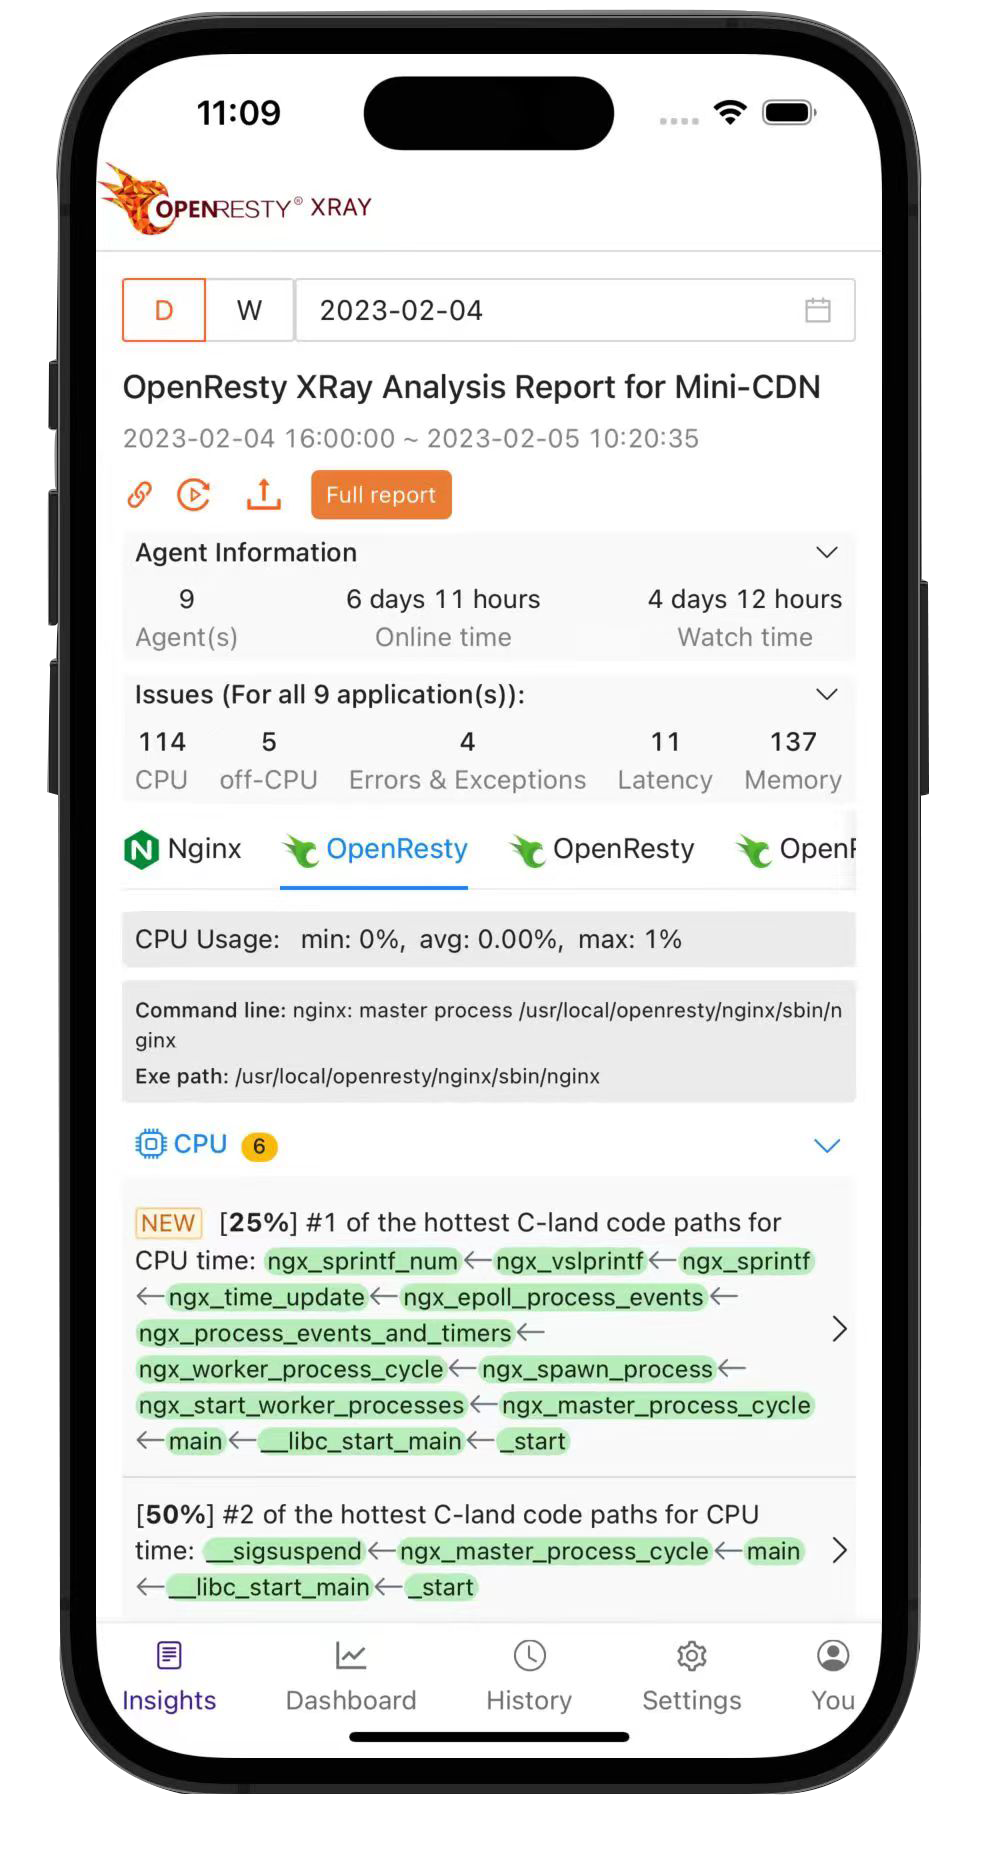
Watch your applications from any where, any time with the OpenResty XRay App for iOS and Android.
We use cookie to make your experience better. By clicking 'I agree' or continuing to use this website you're giving permission for cookies to be stored.
Learn more.

扫描二维码关注微信公众号
微信ID: openrestysoft